Example of sustainability analysis - Visualizing energy-related data from zero emission buildings
Example of sustainability analysis - Visualizing energy-related data from zero emission buildings
Visualizing energy-related data from zero emission buildings
Author: Stian Nyblom
NTNU Open: Visualizing energy-related data from zero emission buildings
Short description
Theme: Prototype and evaluation of a dashboard for energy use in a zero-emission building
Type of Thesis: Development/evaluation of IT solution
Abstract
This study presents a prototype of a dashboard-based visualization solution developed to showcase data from a zero-emission building used as a case example. The solution includes charts displaying data related to various key performance indicators (KPIs), enabling efficient monitoring of the building’s sustainable technologies’ performance.
Evaluation of this visualization solution was carried out through interviews and surveys based on the Technology Acceptance Model (TAM) and the System Usability Scale (SUS), with researchers and first-year architecture students representing two identified stakeholder groups. The surveys aimed to assess the usefulness, user-friendliness, and potential for replacing existing dashboards currently used to visualize the building’s performance data.
The prototype was generally considered user-friendly and useful, though not all researchers found it beneficial, based on the current charts in the solution, for their specific work needs. The visualization solution was also not regarded as a full replacement for the existing Grafana dashboards, but rather as a complementary tool. Further development is suggested to improve its functionality and potential as a standalone solution.
Sustainability analysis
The thesis has clear direct relevance to sustainability as it deals with the presentation and use of data that visualizes energy performance (production and consumption) in zero-emission buildings.
The analysis is based on a dashboard for monitoring energy production and consumption in a zero-emission building (ZEB - Zero Emission Building).
The analysis is based on the use of the system by two primary user groups:
-
Researchers/planners working with sustainable technology and who have extensive knowledge in this area. They may be interested in an overview of the building’s energy performance and may also want access to raw data. These users can use the solution to identify areas that need adjustment or further research, or to learn from the project in the context of future projects.
-
Visitors/residents have limited knowledge of sustainable building technologies but may have a general interest in observing the building’s performance. They have little or no ability to change the system itself, but they can change their behavior, which influences energy consumption, after receiving relevant information.

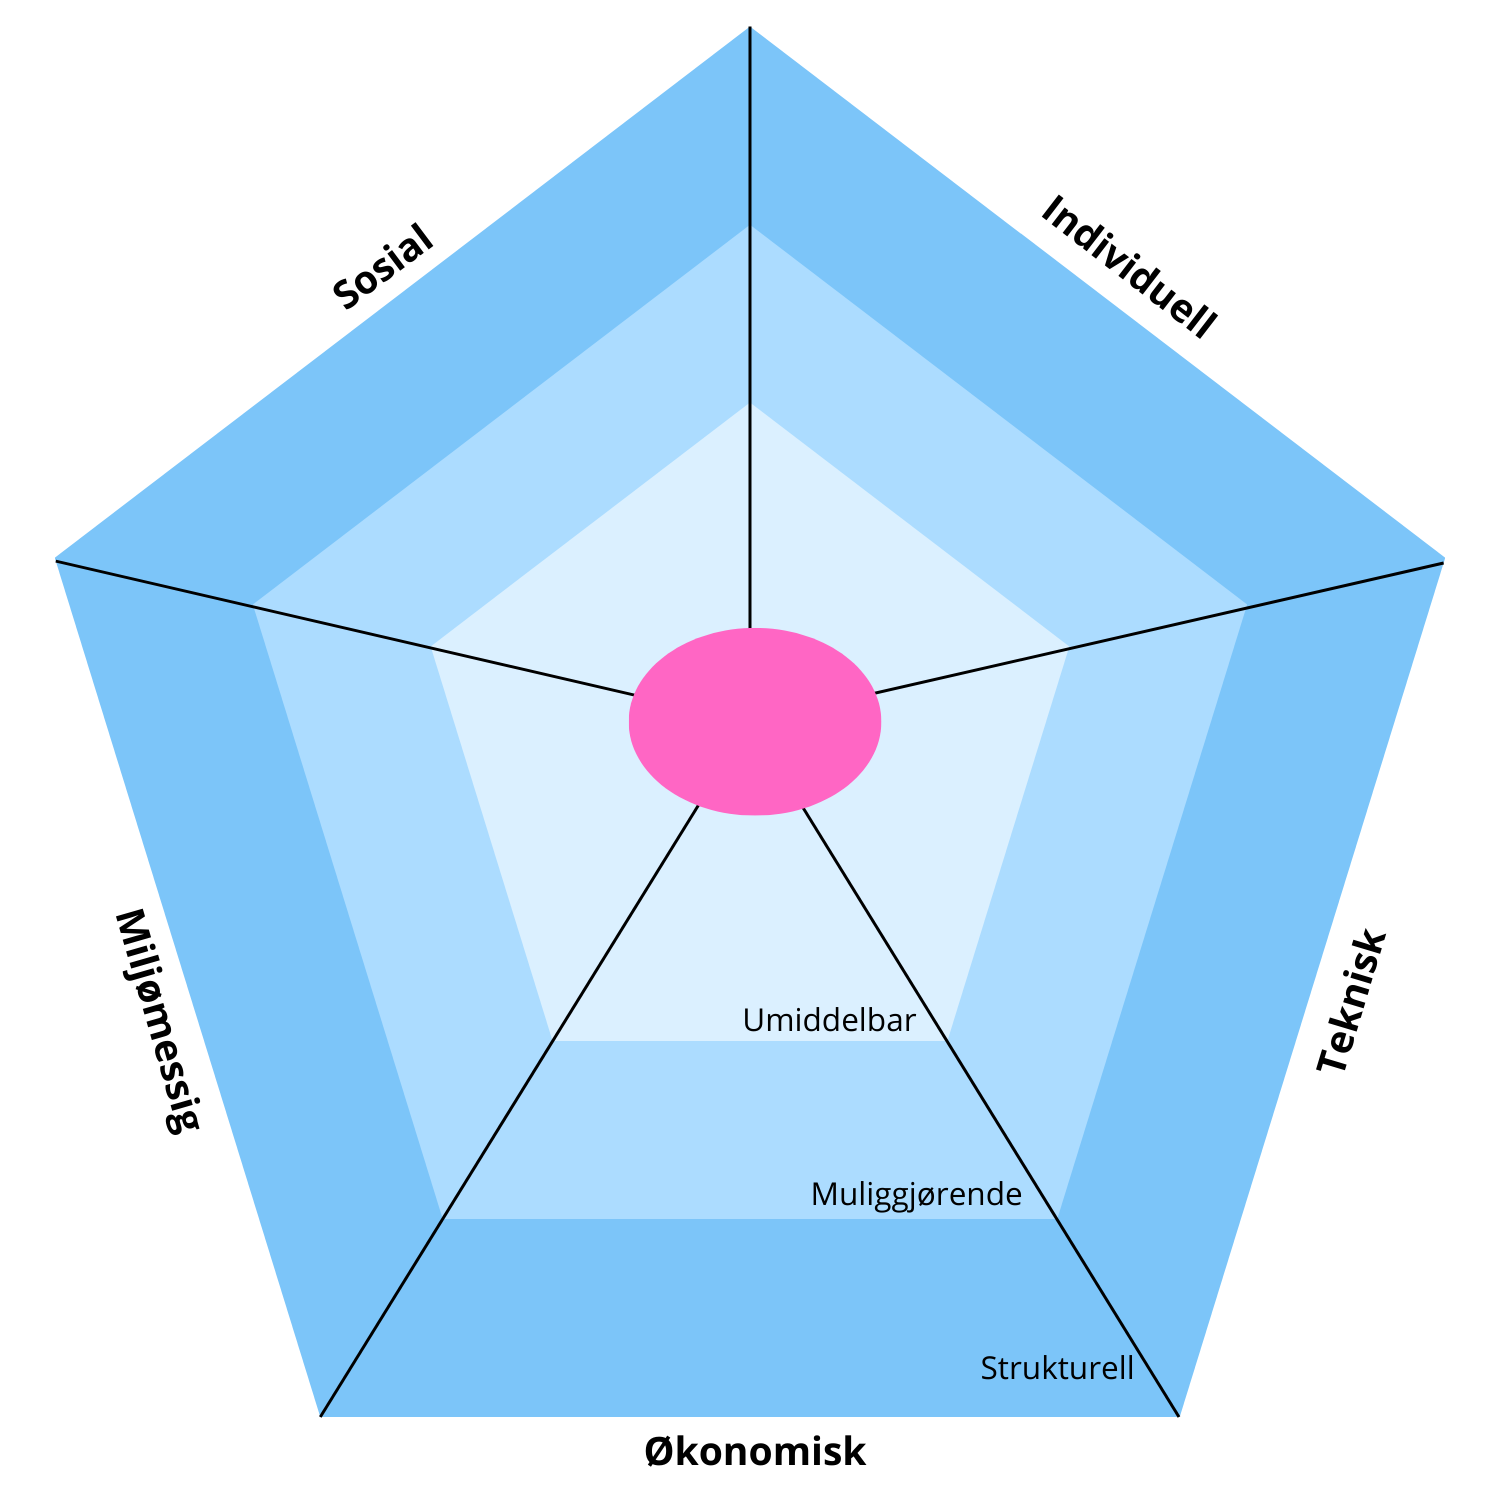
![]()
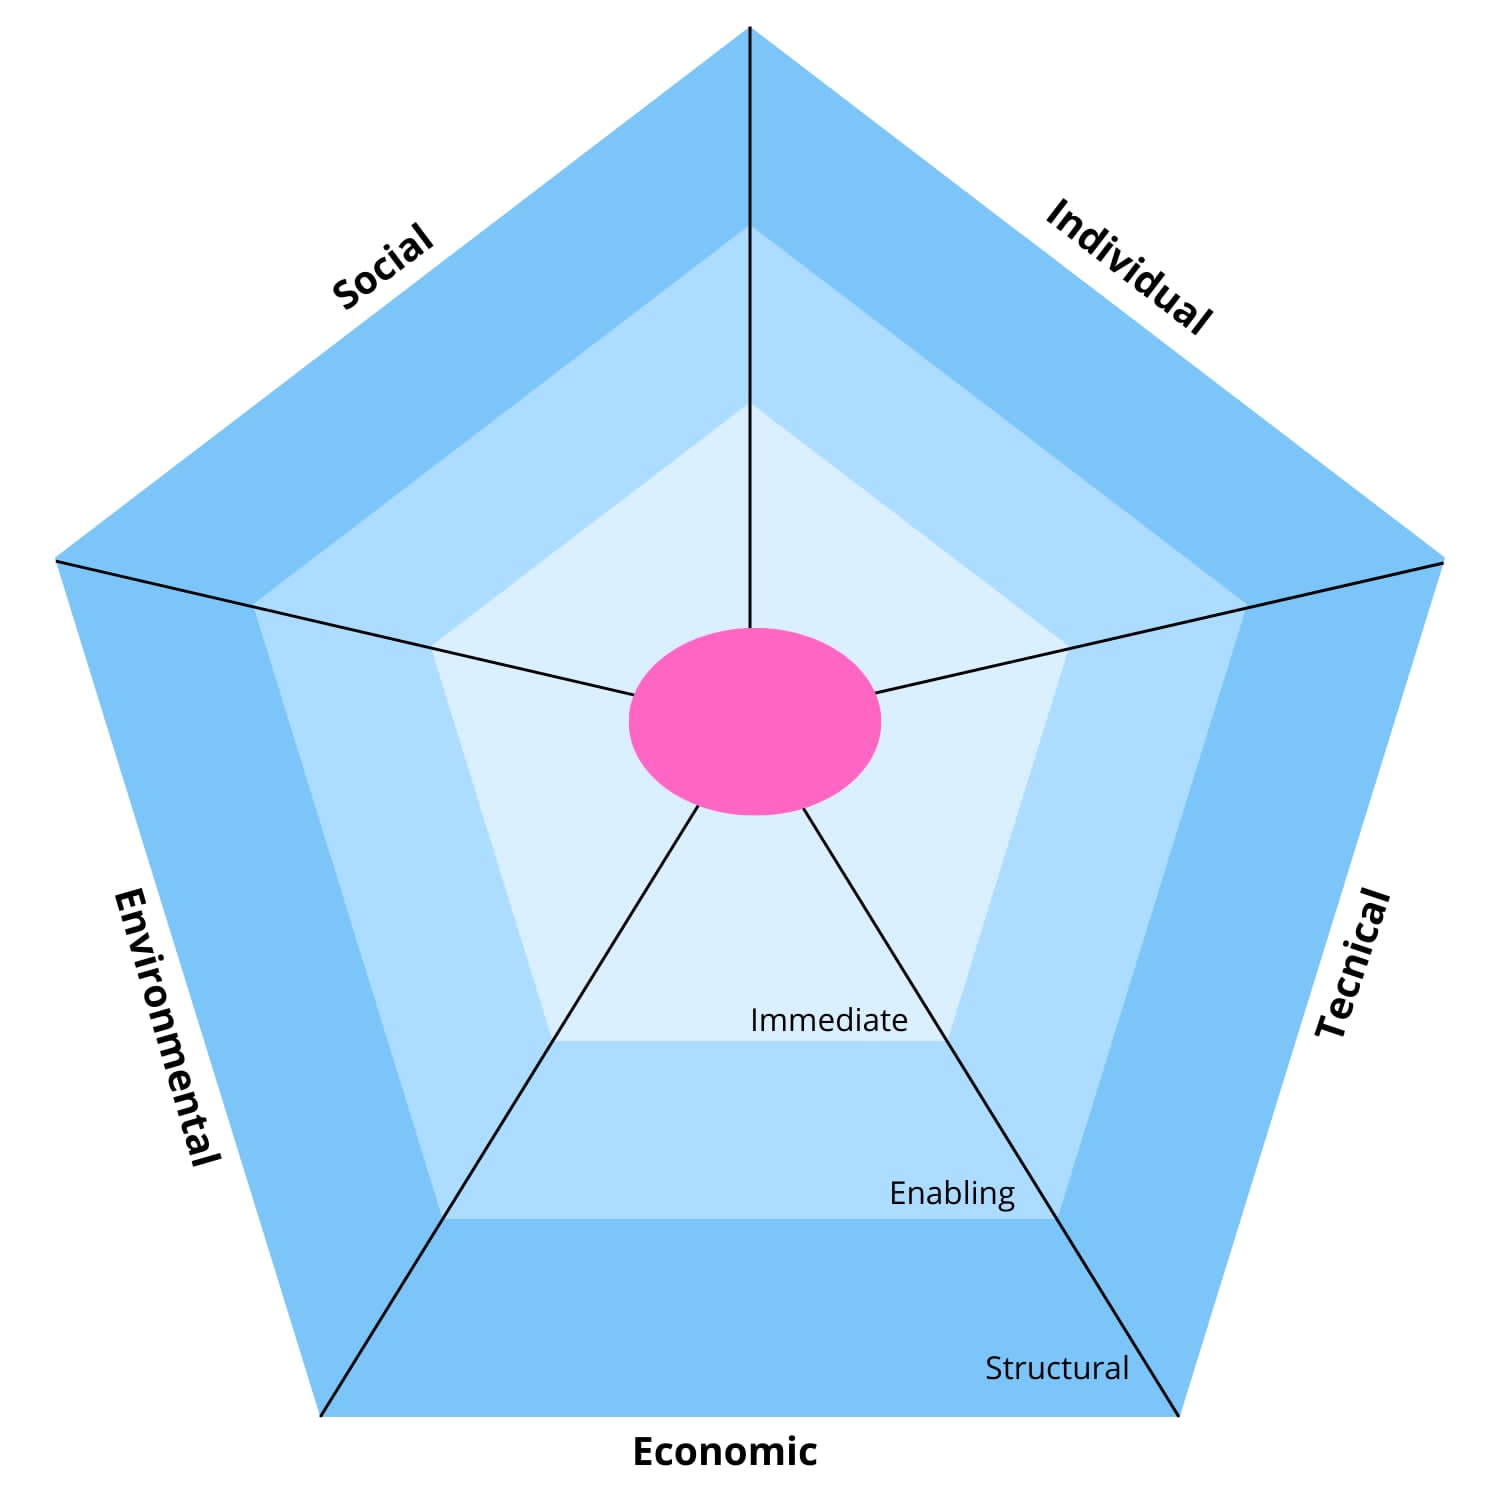
The dashboard provides access to sensor data, which is a positive and immediate impact on the technical dimension.
|
Technical impacts, immediate:
|
This access leads to some challenges which, by requiring resources, can be understood as negative impacts on the technical dimension: both the IT solution and the sensors require maintenance. Maintenance of solar panels and other parts of the physical infrastructure also falls within the technical dimension.
|
Technical impacts, enabling:
|
On the human dimension, we have two positive impacts that can also be understood as assumptions for the analysis: We assume that the tool (the dashboard) is user-friendly and personalized.
Individual Dimension
The dashboard supports learning and personal reflection about energy use and how each user influences the building’s performance. This assumes that the solution is both user-friendly and personalized.
The immediate impacts arise because the user can easily understand and interact with the system in a way that fits their needs.
|
Individual impacts, immediate; positive:
|
At the enabling level, the solution helps users learn about their own energy consumption and become more aware of how their behavior affects energy use.
|
Individual impacts, enabling; positive:
|
Over time, the solution may encourage more sustainable user behavior, but it may also raise privacy concerns if energy data can be connected to specific individuals.
|
Individual impacts, systemic:
|
Social Dimension
The dashboard gives different user groups (researchers, students, residents) access to shared energy data, which can support communication and collaborative initiatives.
The immediate impact is that users gain common access to information, forming a foundation for cooperation and knowledge sharing.
|
Social impacts, immediate; positive:
|
Over time, the solution enables greater engagement and interdisciplinary collaboration among different users.
|
Social impacts, enabling; positive:
|
Long-term impacts may include a stronger sense of community and a more sustainable collaboration culture. However, challenges may arise if some users have more access to or better understanding of the data than others.
|
Social impacts, systemic:
|
On the environmental dimension, the solution has an immediate impact by visualizing energy consumption.
|
Environmental impact, immediate:
|
This information can in turn be used to achieve reduced/minimized energy consumption.
|
Environmental impacts, enabling:
|
At the systemic level, such changes over time, linked to various buildings, can enable the development of a sustainable city.
|
Environmental impacts, systemic:
|
On the economic dimension, the reduced energy consumption will lead to lower energy bills for the building in question. At the same time, maintenance of sensors and the IT solution will incur a cost, which can be seen as a negative economic sustainability impact.
|
Economic impacts, enabling:
|
This is how the table will look:
| ID | Impact | Level | Affects | + / - |
|---|---|---|---|---|
| TI1 | Access to sensor data | Immediate | IU1 | + |
| TE1 | Maintenance of IT solution | Enabling | - | |
| TE2 | Maintenance of sensors | Enabling | - | |
| TE3 | Maintenance of solar panels, etc. | Enabling | - | |
| II1 | User-friendly tool | Immediate | + | |
| II2 | Personalized solution | Immediate | + | |
| IE1 | Learning about personal energy consumption | Enabling | + | |
| IE2 | Increased awareness of personal behavior and impact | Enabling | + | |
| IS1 | Changed behavior (e.g., reduced energy consumption) | Structural | + | |
| IS2 | Poor privacy protection due to collection of behavior-related data | Structural | - | |
| SI1 | Shared access to energy data | Immediate | + | |
| SI2 | Improved communication and collaboration between user groups | Immediate | + | |
| SE1 | Increased engagement and participation in sustainability discussions | Enabling | + | |
| SE2 | Knowledge sharing between users with different backgrounds | Enabling | + | |
| SS1 | Strengthened sense of community and sustainability culture | Structural | + | |
| SS2 | Differences in access and understanding that weaken trust | Structural | - | |
| EnI1 | Visualization of energy consumption | Immediate | + | |
| EnE1 | Minimization of energy consumption | Enabling | + | |
| EnS1 | Enabling a sustainable city | Structural | + | |
| EcE1 | Lower energy bills | Enabling | + | |
| EcE2 | Higher IT costs | Enabling | - |


