Carbon Track and Trace (CTT) - Urban GHG Emission Monitoring
Carbon Track and Trace (CTT)
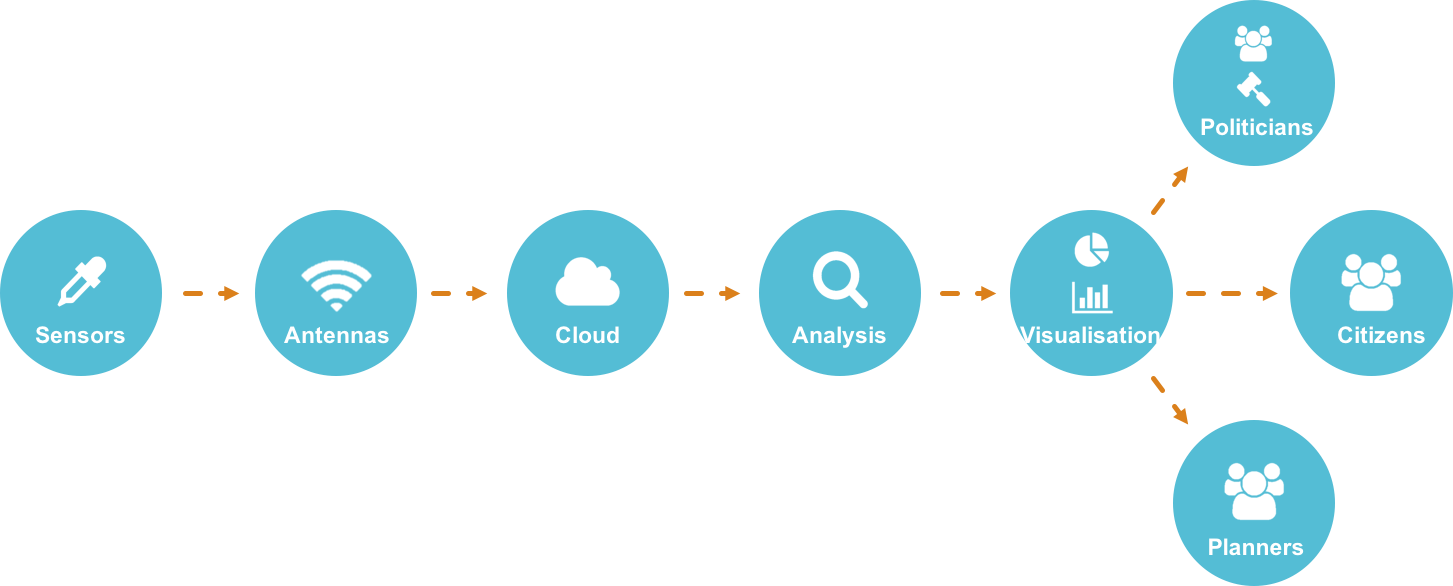
The Carbon Track and Trace (CTT) project is intended to provide cities with real-time greenhouse gas (GHG) measurement capability. Traditional methods of building and maintaining municipal GHG emission inventories are expensive, time-consuming, and are of questionable utility for mitigation decision and planning support processes. CTT couples low-cost, open source Internet of Things sensors to a Big Data analytics platform that provides cities and regions with a unique capacity to directly measure the impacts of their policy and planning decisions and to develop a semi-autonomous system for building, maintaining, and reporting their annual GHG emissions. Pilot partners are Trondheim, Norway and Vejle, Denmark.
Project
CTT is a joint project of the NTNU departments of Architecture and Design (AB) and Computer Science (IDI) and part of NTNU Smart Sustainable Cities.
CTT is funded by LoCaL, the Low Carbon City Lab flagship of Climate-KIC.
Spinoff
CTT AS was a spinoff of the project. It delivered RICK, a smart software platform that collects and analyzes data to visualize emission impact.
People
-
Dirk Ahlers Senior Researcher
+4740532339 dirk.ahlers@ntnu.no Department of Architecture and Planning -
John Krogstie Professor in Information Systems
+47-73412776 +4793417551 john.krogstie@ntnu.no Department of Computer Science -
Annemie Bertha Marcella Wyckmans Professor, head of NTNU Smart Sustainable Cities
+4740871863 annemie.wyckmans@ntnu.no Department of Architecture and Planning
Publications
Analysis and Visualization of Urban Emission Measurements in Smart Cities. Dirk Ahlers, Frank Kraemer, Anders Braten, Xiufeng Liu, Fredrik Anthonisen, Patrick Driscoll, John Krogstie. EDBT 2018.
A Measurement-Driven Approach to Understand Urban Greenhouse Gas Emissions in Nordic Cities. Dirk Ahlers, Patrick Driscoll, Frank Alexander Kraemer, Fredrik Anthonisen, John Krogstie. Norwegian Informatics Conference 2016.
Understanding challenges in municipal greenhouse gas emissions inventories. Dirk Ahlers, Patrick Driscoll. IEEE ICE ITMC 2016.
CTT 2.0 Carbon Track and Trace, NILUs know-how and experience from previous research activities. Sundseth, K., Castell, N., Marsteen, L., Dauge, F.R., Ødegård, R., Driscoll, P., Anthonisen, F., Vesterkjær, A. NILU report, 34/2016. Kjeller: NILU.
Supporting Municipal Greenhouse Gas (GHG) Emission Inventories Using Business Process Modeling: A Case Study of Trondheim Municipality. Dirk Ahlers, John Krogstie, Patrick Driscoll, Hans-Einar Lundli, Simon-James Loveland, Carsten Rothballer, Annemie Wyckmans. Business Process Management Workshops 2016, Revised Papers. (Workshop on Sustainability-Aware Business Process Management @ BPM2016), LNBIP vol.281, Springer, 2017.
Media
CTT is part of the Libelium White Paper on 50 IoT success stories. Overview and Full case study: Enhancing environmental control and reducing emissions in Nordic Smart Cities
Article from the Vejle installation: Nu skal Vejles CO2-udslip kortlægges
Climathon 2016 report: Article by the local newspaper in Trondheim, Adressa: "Jobber dugnad for å måle klimautslipp i Trondheim" [English: "Doing voluntary work in order to measure greenhouse gas emissions in Trondheim"].
Deliverables and Reports
CTT Phase 2
D1.4 CTT2.0 Carbon Track and Trace Final Report
This document is the high-level description of the project results and technical achievements. The main result consists of a prototype GHG measurement and reporting system showcasing the components from sensors and measurement devices through Internet of Things sensor networks, gateways, cloud storage, data collection, processing, and visualization for stakeholders and towards decision support. It additionally explores different sensor setups and processing systems, integration into emission inventories, and gap analyses as a roadmap from manual to automatic data gathering and emission monitoring and inventories.
D2.4 CTT2.0 Technical Architecture
The technical architecture describes the overall CTT concept, the coordination and cooperation of its components, deployment and installation in the field, data flows, components, and analysis and visualization systems.
D3.1 Prototype and Deployment Big Data Analytics Platform
This report discusses requirements, hardware, components, and initial air quality analyses of an analysis prototype.
This report provides an overview of the data flow from the sensors through the cloud and to databases to provide real-time data from the IoT sensors to different user groups including decision makers and the public. Collection of data from other sources is discussed and a flexible visualization tool is presented.
D4.1 GPC inventory data quality assessment
This study provides a data quality assessment based on cities’ reported GPC Inventories, investigating the existing data quality and availability of transport-related emissions in cities that currently used the GPC reporting methodology.
D4.2 Workflows for sensor data integration into inventories: Options for Clearpath and GPC
Data on GHG emissions has become the cornerstone for implementation of mitigation projects. This report discusses the potential of real-time sensor-based data to be integrated into GHG inventories and how the integration could be pivotal for monitoring policy impact.
D4.3 Cost-benefits of Greenhouse Gas (GHG) Inventory activity-based and automated data-gathering
This report develops insight into the processes within municipalities to estimate effort and quality of existing emission inventories and systems. It gives better insight into pressure points for cities and ways that CTT can support cities aiming at understanding and reducing their emissions. This study helps close the cost-benefit information gap, comparing activity-based data with automated, sensor-based emission inventories, both in a short- and long-term perspective. The study helps to understand present perceptions and future expectations for the scale of benefits and co-benefits when applying activity- or sensor-based systems to specific energy sectors.
D4.4 Prototype 3-D GIS city model of Vejle with GHG emissions from installed sensors
Visualization prototype of a 3D city model of Vejle with access to live data from installed sensors.
CTT Phase 1
Gap analysis of greenhouse gas (GHG) emissions inventory methods for Trondheim municipality (D2)
Some key topics discussed in this gap analysis include calculation vs. measurement, system boundaries count, data quality and reliability, the statistics data problem, multiple data sources and multiple reporting platforms.
Workflow analysis of greenhouse gas (GHG) emission inventory methods for Trondheim municipality (D4)
The workflow analysis presented here analyses the data collection and processing for municipal GHC emission inventories and highlights issues of complexity, data sourcing, data quality, and automation.