Video for Quality - evaluation
Evaluation and evaluation tools
Evaluation and evaluation tools
When VfK was studying the effects of video in teaching, we strived to find objective evaluation tools. Subjective evaluations have some value, but in many cases, they can give a misleading picture. The instruments we used were statistics on video usage (viewer statistics), eye-tracking technology to see where the user's attention is directed, and various "concept inventories" where we study the effect of teaching on basic principles. In addition, students' attitudes were also studied.
Viewer statistics
Most video portals log information about the use of videos. It can be about geographical location, time, duration and number of viewers. Here it matters which portal is used, as not all data stored is reliable, partly due to problems with programming and web robots. Data that we use in VfK is based on the number of unique daily visitors, as it is not appropriate to count a visitor several times during the same day and video. The data is collected and organized by weekly use and individual videos. This gives us a good picture of how much a video or video series is used. From the data, we also get information that makes it possible to conclude how videos are used.

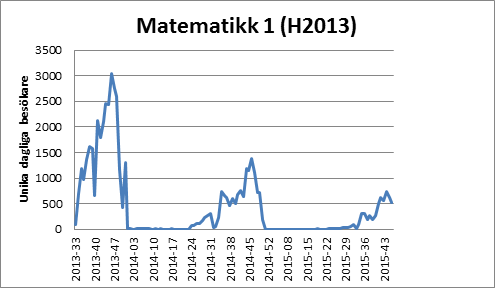
The figure shows the number of visitors per week for a video series of lectures in Mathematics 1 from 2013 to 2015. We see that its use decreases drastically the following year. A closer study of individual videos shows that they are primarily watched within two weeks of the recorded lecture. The degree of reuse is thus limited, which is often also true for other video series as well.
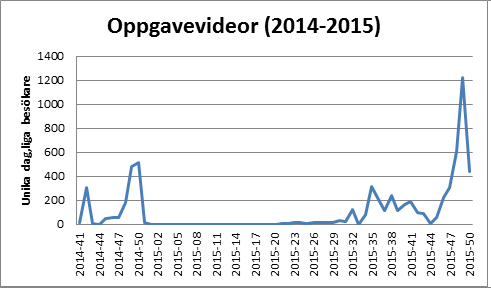
If we look at the statistics for a video series with problem-solving (published in 2014), we see a different pattern of use.

In this case, its use lies mainly in connection with exam preparation. Reuse in subsequent semesters also appears to be greater.
Eye-tracking
An important aspect when it comes to videos and video teaching is to make sure that viewers are focused on the "right" spot and that they get the essence of what is being presented. It's also important to identify distractions that might steal attention. Temporal attention is also important so that one knows how long an object should appear and when pauses should be entered. In addition, it is also possible to study the impact of various design elements.
Eye-tracking means that by recording the direction of the eye of the viewer at the same time as the viewer is looking at something. In this way, you can follow the gaze and where the attention is. This allows one to see where on a screen the gaze is directed. When studying in lecture halls, you can wear glasses with a stage camera and thus see the direction of the gaze. VfK studies both the attention in lectures and videos, to investigate the differences between live lectures and videos.
This part of VfK is now a stand-alone project working on attention and how students read different text or figures.
Concept inventories
To study the learning outcomes, we have used concept inventories. Since we need a measuring instrument that does not vary over time as an exam does, and which primarily looks at understanding, it was natural to choose fully developed concept inventories. However, these must be translated and evaluated to determine their suitability. Here, for example, the level may be too low, the questions may be culturally conditioned, or they may be difficult to translate. An evaluation of the Force Concept Inventory (FCI) has been carried out with responses from various courses within different study programmes. Although the FCI showed good discrimination – that is, the test distinguishes the weakest – the difficulty level was somewhat low for certain study programmes, with a risk of ceiling effects for student groups as a whole. However, the test can work on low- and medium-achieving students. In addition, these are the target groups for the VfK project. Also, the BEMA test (Brief Electro Magnetic Assessment) in electromagnetism has been tested (in an expected high-performance group) and proven to be appropriate for the purpose. Here, the test must be translated and possibly modified in terms of certain questions. Within chemistry, a concept inventory has also been developed. This has been tested and applied to some chemistry courses.
This part of VfK has also developed in a stand-alone project.
Attitude survey
It is also important to know the students' attitudes towards studies and the topics studied, to investigate if videos affected these. Here we used CLASS (Colorado Learning Attitudes about Science Survey) since this exists for physics, chemistry and biology. That attitudes towards the subject and teaching are important for learning is one of the observations. A genuine interest in the subject and a "correct" attitude to their studies, primarily in terms of conceptual understanding, have been shown to have an impact on the results.
However, the students' attitudes are not fixed and will be influenced by a large number of factors, not least by the content and character of the teaching. One must assume that there is a different culture at a university than in high school, and students who cannot adapt will often drop out. This does not necessarily have anything to do with intellectual capacity, but may, among other things, be about precise problems in adapting to the culture. This has been studied, and the study continues in the form of a longitudinal study, as well as in a comparative study at the Chalmers University of Technology.
This part is also continuing as a stand-alone project.
VfK logo

